The eight climographs show yearly temperature (line graph and left vertical axis) and precipitation (bar graph and right vertical axis) averages for each month for some locations on Earth.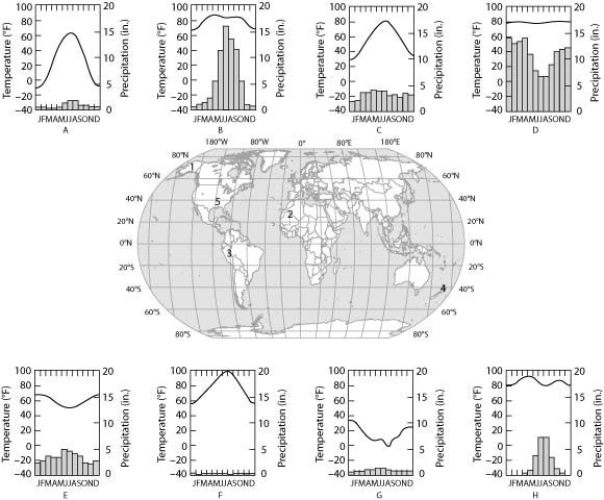
Which climograph shows the climate for location 4?
A) A
B) C
C) E
D) G
Correct Answer:
Verified
Q25: Which of the following statements best describes
Q33: Use the following figures to answer the
Q34: Suppose that the number of bird species
Q36: Use the following figures to answer the
Q37: If global warming continues at its present
Q39: The eight climographs show yearly temperature (line
Q40: If you conclude that vegetation at every
Q41: Which of the following types of organisms
Q42: Studying species transplants is a way that
Q43: Imagine that a deep temperate zone lake
Unlock this Answer For Free Now!
View this answer and more for free by performing one of the following actions

Scan the QR code to install the App and get 2 free unlocks

Unlock quizzes for free by uploading documents