Use the following figures to answer the question below.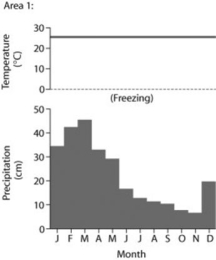
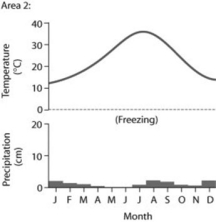
Based on the data in the figures, which of the following statements are correct?
I. Area 1 has more average precipitation than Area 2.
II. Area 1 has a higher average temperature than Area 2.
III.Both areas have low variation in monthly precipitation.
IV.Area 2 has a lower annual temperature variation compared to Area 1.
A) only I and III
B) only II and IV
C) only II, III, and IV
D) only I, II, and III
Correct Answer:
Verified
Q25: Which of the following statements best describes
Q31: The eight climographs show yearly temperature (line
Q32: The eight climographs show yearly temperature (line
Q33: Use the following figures to answer the
Q34: Suppose that the number of bird species
Q37: If global warming continues at its present
Q38: The eight climographs show yearly temperature (line
Q39: The eight climographs show yearly temperature (line
Q40: If you conclude that vegetation at every
Q41: Which of the following types of organisms
Unlock this Answer For Free Now!
View this answer and more for free by performing one of the following actions

Scan the QR code to install the App and get 2 free unlocks

Unlock quizzes for free by uploading documents