The graph below shows the fundraising of the Republican National Committee, in millions of dollars, as a function of the date.During the period shown on the graph when was the minimum amount of funds raised, and what was that amount? 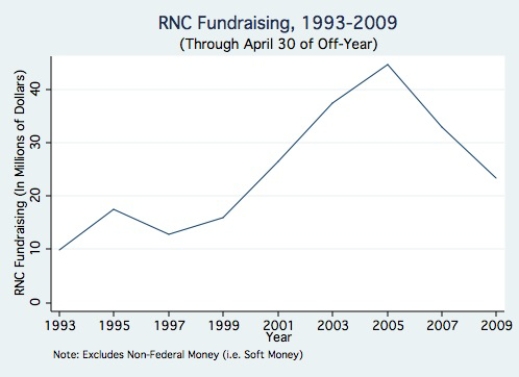
A) The Committee raised 10 million dollars in 1993.
B) The Committee raised 17 million dollars in 1995.
C) The Committee raised 12 million dollars in 1997.
D) The Committee raised 21 million dollars in 2009.
Correct Answer:
Verified
Q28: The graph below shows the maximum angle
Q29: The graph below shows the blood-glucose levels,
Q30: The graph below shows the value, in
Q31: The graph below shows the numbers, in
Q32: Below is a graph of a function
Q33: The graph below shows the maximum angle
Q35: The graph below shows the atmospheric pressure,
Q36: Which of the following stories best fits
Q37: The graph below shows the blood-glucose levels,
Q38: The graph below shows the growth rate
Unlock this Answer For Free Now!
View this answer and more for free by performing one of the following actions

Scan the QR code to install the App and get 2 free unlocks

Unlock quizzes for free by uploading documents