The graph below shows the atmospheric pressure, in millibars of mercury, as a function of altitude in meters.According to the graph, which of the following sentences best describes the relationship between pressure and altitude? 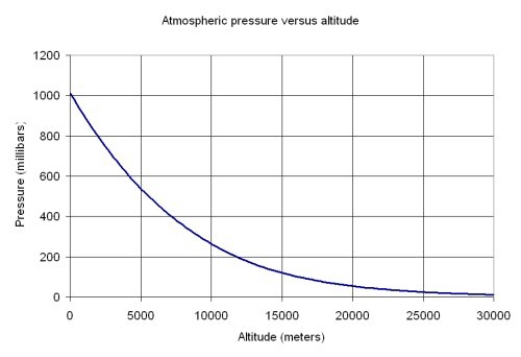
A) Pressure decreases with altitude, but at higher altitudes a small change in altitude makes relatively little difference in pressure.
B) Pressure decreases at an increasing rate as altitude increases.
C) Pressure is concave down with respect to altitude.
D) As altitude increases pressure does not change.
Correct Answer:
Verified
Q28: The graph below shows the maximum angle
Q29: The graph below shows the blood-glucose levels,
Q30: The graph below shows the value, in
Q31: The graph below shows the numbers, in
Q32: Below is a graph of a function
Q33: The graph below shows the maximum angle
Q34: The graph below shows the fundraising of
Q36: Which of the following stories best fits
Q37: The graph below shows the blood-glucose levels,
Q38: The graph below shows the growth rate
Unlock this Answer For Free Now!
View this answer and more for free by performing one of the following actions

Scan the QR code to install the App and get 2 free unlocks

Unlock quizzes for free by uploading documents