True/False
The graph shown below can be appropriately modeled by a linear function. 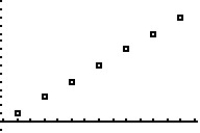
Correct Answer:
Verified
Related Questions
Q1: Suppose f is a linear function and
Q2: If data for Q3: Suppose f is a linear function and Q4: If data for Q5: Suppose f is a linear function and Q6: A data table for Q7: The graph shown below can be appropriately Unlock this Answer For Free Now! View this answer and more for free by performing one of the following actions Scan the QR code to install the App and get 2 free unlocks Unlock quizzes for free by uploading documents![]()
![]()
![]()

