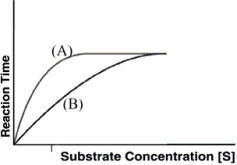
-Figure 3.2 shows the relative activity of an enzyme in two states: high affinity and low affinity. Which curve, A or B, represents the high affinity state?
Correct Answer:
Verified
Q174: In a reaction that proceeds in the
Q175: Glycogenolysis is an example of a catabolic
Q176: Protein kinases target phosphorylation in covalent regulation
Q177: The following equation, C6H12O6 + 6 O2
Q178: Describe the factors that affect the rates
Q179: Several types of chemical reactions are involved
Q180: With the plethora of enzymes that are
Q181: During end -product inhibition, the final product
Unlock this Answer For Free Now!
View this answer and more for free by performing one of the following actions

Scan the QR code to install the App and get 2 free unlocks

Unlock quizzes for free by uploading documents