Table
Factors for Calculating Three- Sigma Limits for the - chart and -chart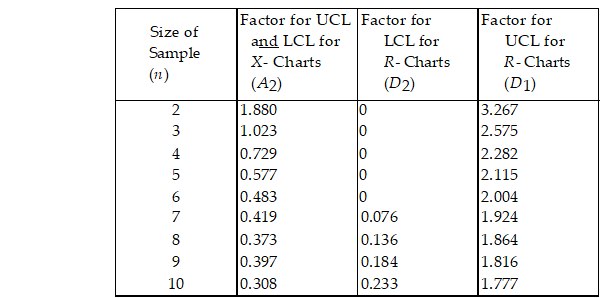
-Historically, the average diameter of the holes drilled has been 0.25 cm and the average range has been 0.1 cm. Determine the central line and upper and lower control limits for an and an  R- chart, assuming samples of size 8 will be taken. Use Table 7.1.For the chart, what is the value of the
A) less than or equal to 0.10
B) greater than 0.10 but less than or equal to 0.19
C) greater than 0.19 but less than or equal to 0.29
D) greater than 0.29
Correct Answer:
Verified
Q62: Which one of the following statements relating
Q63: A product has five major components with
Q64: The manufacturing of compact disks requires four
Q65: Which of the following statements is NOT
Q66: Which one of the following statements about
Q68: Which one of the following is part
Q69: Which one of the following is NOT
Q70: A manager of a fiberglass molding operation
Unlock this Answer For Free Now!
View this answer and more for free by performing one of the following actions

Scan the QR code to install the App and get 2 free unlocks

Unlock quizzes for free by uploading documents