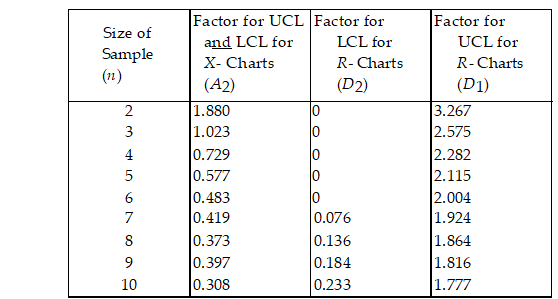
-Historically, the average diameter of the holes drilled has been 0.25 cm and the average range has been 0.1 cm. Determine the central line and upper and lower control limits for an and an R- chart, assuming samples of size 8 will be taken. Use Table 7.1. For the R- chart, what is the value of the LCLR?
A) less than or equal to 0.010
B) greater than 0.010 but less than or equal to 0.020
C) greater than 0.020 but less than or equal to 0.030
D) greater than 0.030
Correct Answer:
Verified
Q42: Table
Q43: Which one of the following statements concerning
Q44: Which one of the following statements is
Q45: Continuous improvement is a philosophy that
A) ensures
Q46: The upper and lower specifications for a
Q48: The upper limit and lower specifications for
Q50: One of the quality "gurus" defined quality
Q51: Judging service quality on the basis of
Q52: The concept of quality at the source
Q113: Historically, the average proportion of defective bars
Unlock this Answer For Free Now!
View this answer and more for free by performing one of the following actions

Scan the QR code to install the App and get 2 free unlocks

Unlock quizzes for free by uploading documents