Multiple Choice
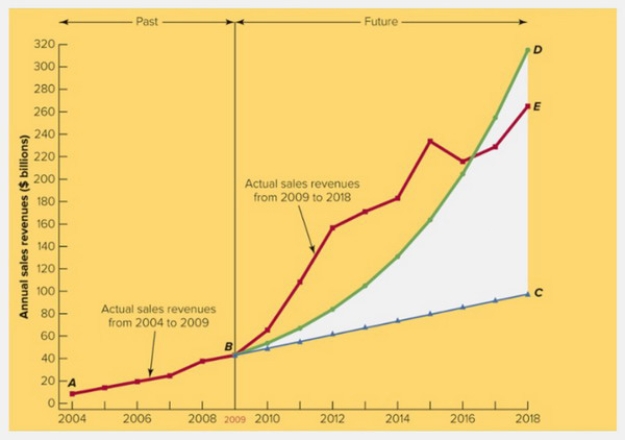 Figure 2-11
-Based on the information in Figure 2-11 above, the planning gap between 2009 and 2018, as represented by the wedge labeled DBC
A) is widening.
B) is narrowing.
C) is staying the same.
D) cannot be quantified.
E) began to open in 2004.
Correct Answer:
Verified
Related Questions
Q298: Central features of a Gantt chart include
Q299: Which statement reflects the key elements in
Q300: In a typical manufacturing firm, the structure
Unlock this Answer For Free Now!
View this answer and more for free by performing one of the following actions

Scan the QR code to install the App and get 2 free unlocks

Unlock quizzes for free by uploading documents