Exhibit 10-2
A manager of a hotel chain is interested in investigating whether there is a relationship between staff labor hours and bed-day occupancy incurred by a hotel in a month.The manager randomly selected 17 of the hotels in the chain across the country and recorded, for each of the hotels, the staff's total labor hours for the month of July and the number of bed-days of occupancy for that month. (A hotel has occupied one "bed-day" if one bed is occupied (rented) for an entire day.) The manager is interested in seeing if the labor hours incurred can be predicted from the number of bed-days of occupancy on a monthly basis.
The sample data were analyzed using Excel.Shown below is part of the regression analysis output.
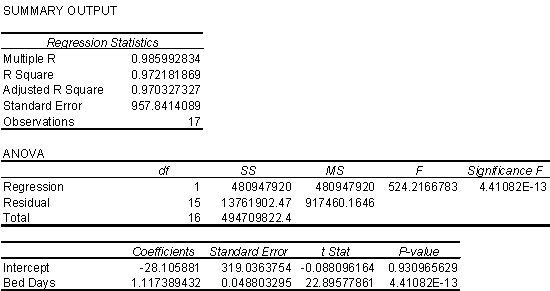
-Refer to Exhibit 10-2.According to this regression analysis,if the number of bed-days increases by 200,what is the predicted change in the number of labor hours required for a given month?
A) a decrease of 5621.2
B) a decrease of 17.6
C) an increase of 223.5
D) an increase of 882.2
Correct Answer:
Verified
Q49: Everything else remaining constant,when the sample size
Q50: Three scatter diagrams are given below.How many
Q51: Which of the following is NOT an
Q52: At the organizational level,statistics helps executives with
Q53: A quality engineer in a light bulb
Q54: Calculating the average value of 5 sample
Q56: At the process level,statistical thinking can motivate
Q57: Exhibit 10-2
A manager of a hotel chain
Q59: An experiment that evaluates the effect of
Q60: Exhibit 10-2
A manager of a hotel chain
Unlock this Answer For Free Now!
View this answer and more for free by performing one of the following actions

Scan the QR code to install the App and get 2 free unlocks

Unlock quizzes for free by uploading documents