Three scatter diagrams are given below.How many of the diagrams present data that can be described by a linear relationship and,therefore,justifiably summarized by the correlation coefficient?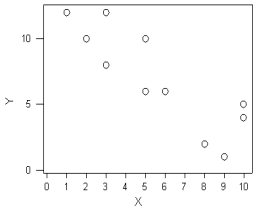
Plot A Plot B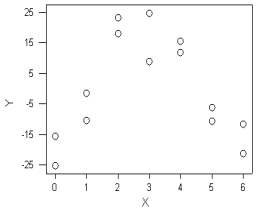
Plot C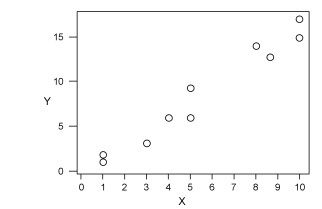
A) Plot A
B) Plot B
C) Plot A and Plot B
D) Plot A and Plot C
Correct Answer:
Verified
Q45: Understanding processes provides the context for determining
Q46: Sample _ are often used as estimators
Q47: Exhibit 10-3
An engineer collected data from three
Q49: _ arise from external sources that are
Q51: Which of the following is NOT an
Q52: At the organizational level,statistics helps executives with
Q53: A government report gives a 99% confidence
Q53: A quality engineer in a light bulb
Q54: Calculating the average value of 5 sample
Q55: Exhibit 10-2
A manager of a hotel chain
Unlock this Answer For Free Now!
View this answer and more for free by performing one of the following actions

Scan the QR code to install the App and get 2 free unlocks

Unlock quizzes for free by uploading documents