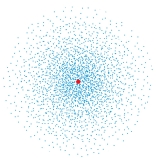
The following image is a dot plot of the ground state of the hydrogen atom.The dots represent: 
A) all the possible positions of the electron
B) every electron in the atom
C) the electron wave function
D) the volume probability density for the electron
E) the density of the electron cloud
Correct Answer:
Verified
Q22: The series limit for the Balmer
Q23: Take the potential energy of a hydrogen
Q29: The binding energy of an electron in
Q33: When a hydrogen atom makes the transition
Q35: Take the potential energy of a hydrogen
Q36: The quantum number n is most closely
Q37: Take the potential energy of a hydrogen
Q40: The figure shows the energy levels for
Q41: If the wave function
Q43: If P(r)is the radial probability density for
Unlock this Answer For Free Now!
View this answer and more for free by performing one of the following actions

Scan the QR code to install the App and get 2 free unlocks

Unlock quizzes for free by uploading documents