The graph below depicts the rise in resistance to warfarin in a rat population. Notice that after reaching a peak of 100% resistance, resistance in the population declined. Please provide a plausible evolutionary explanation for this. 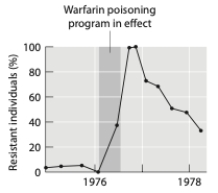
Correct Answer:
Verified
Q61: A researcher performs an experiment on fruit
Q62: Contrast evolution by natural selection with evolution
Q63: Considering the principles of mutation, natural selection,
Q64: Explain how landscape genetics can influence the
Q65: Earth's biotic and abiotic environments are changing
Q66: You are studying a population of 100
Q67: Below you see graphs that depict the
Q68: Why might an endangered species, whose population
Q69: Explain the four assumptions of the Hardy-Weinberg
Q70: Compare two examples of genetic drift: the
Unlock this Answer For Free Now!
View this answer and more for free by performing one of the following actions

Scan the QR code to install the App and get 2 free unlocks

Unlock quizzes for free by uploading documents