Refer to the graph shown. If a firm expected to produce 900 units when it built its plant but now desires to reduce its output to 600 units in the short run, it will use the plant size represented by: 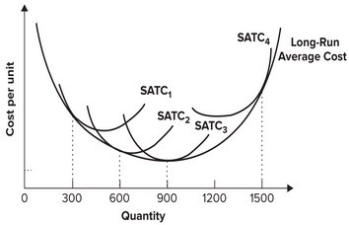
A) SATC1.
B) SATC2.
C) SATC3.
D) SATC4.
Correct Answer:
Verified
Q61: Which of the following provides the best
Q71: In the long run:
A) all inputs are
Q73: Which of the following is an accurate
Q74: Refer to the graph shown. If the
Q75: Refer to the graph shown. A firm
Q77: Refer to the graph shown. If a
Q78: The long-run average cost of producing 19
Q78: Refer to the graph shown. If a
Q80: Refer to the graph shown. A firm
Q85: The long-run average cost curve is tangent
Unlock this Answer For Free Now!
View this answer and more for free by performing one of the following actions

Scan the QR code to install the App and get 2 free unlocks

Unlock quizzes for free by uploading documents