Refer to the graph shown. If the firm wants to produce 900 units of output, it should use the plant size represented by: 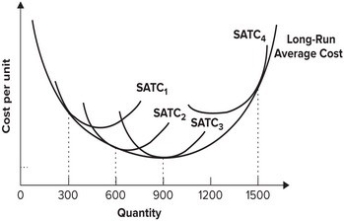
A) SATC1.
B) SATC2.
C) SATC3.
D) SATC4.
Correct Answer:
Verified
Q61: Which of the following provides the best
Q68: Long-run average costs at any output level
Q69: The upward-sloping portion of the short-run average
Q71: In the long run:
A) all inputs are
Q73: Which of the following is an accurate
Q75: Refer to the graph shown. A firm
Q76: Refer to the graph shown. If a
Q77: Refer to the graph shown. If a
Q78: The long-run average cost of producing 19
Q78: Refer to the graph shown. If a
Unlock this Answer For Free Now!
View this answer and more for free by performing one of the following actions

Scan the QR code to install the App and get 2 free unlocks

Unlock quizzes for free by uploading documents