Refer to the graph below. 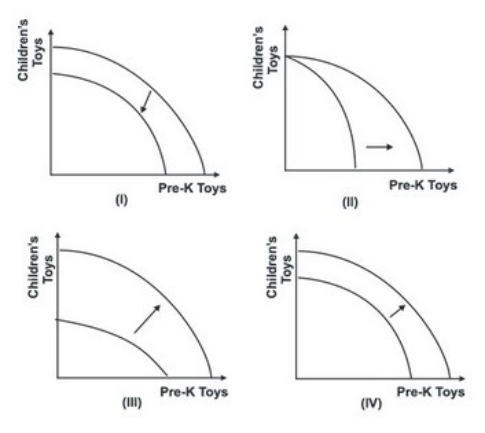 Which of the shifts explains what would happen to the production possibility curve if improved technologies increased the production of prekindergarten (Pre-K) toys by 25 percent and the production of children's toys by 50 percent?
A) I
B) II
C) III
D) IV
Correct Answer:
Verified
Q55: If no resources had a comparative advantage
Q56: Refer to the graph below. 
Q57: Refer to the graph below.
Q58: Refer to the graphs shown. The discovery
Q59: Refer to the graph below.
Q61: Given the production possibility tables for the
Q62: Suppose that in Slovakia one unit of
Q63: The production possibility frontiers of Northland and
Q64: John and Jane Smith are both economists
Q65: Refer to the graph shown.
Unlock this Answer For Free Now!
View this answer and more for free by performing one of the following actions

Scan the QR code to install the App and get 2 free unlocks

Unlock quizzes for free by uploading documents