Refer to the graph below. 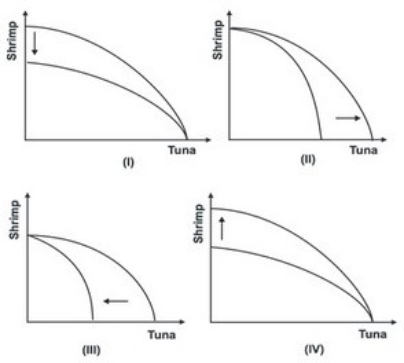 Which of the shifts explains what would happen to the production possibility curve if restrictions were imposed on tuna fishing?
A) I
B) II
C) III
D) IV
Correct Answer:
Verified
Q51: A resource is said to have a
Q52: According to Adam Smith, individuals are directed
Q53: Refer to the graph shown. Destruction of
Q54: Refer to the graph below. 
Q55: If no resources had a comparative advantage
Q57: Refer to the graph below.
Q58: Refer to the graphs shown. The discovery
Q59: Refer to the graph below.
Q60: Refer to the graph below.
Q61: Given the production possibility tables for the
Unlock this Answer For Free Now!
View this answer and more for free by performing one of the following actions

Scan the QR code to install the App and get 2 free unlocks

Unlock quizzes for free by uploading documents