Refer to the graphs shown. An increase in quantity demanded is best shown by which arrow? 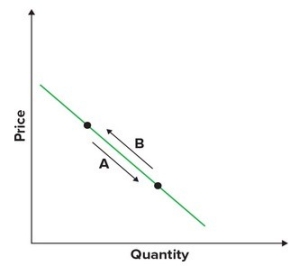
A) A
B) B
C) C
D) D
Correct Answer:
Verified
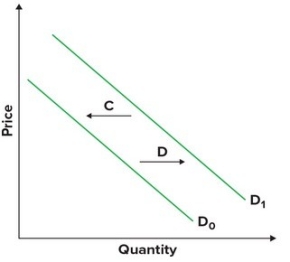
Q42: Refer to the graphs shown. The arrow
Q43: To derive a market demand curve from
Q44: Refer to the graph showing the demand
Q45: Consider the following demand table and the
Q46: Refer to the graphs shown. Assume the
Q48: Suppose farmers can use their land to
Q49: Refer to the following graphs:
Q50: Which statement is not consistent with the
Q51: The law of supply states that, other
Q52: Given the graph, the quantity that would
Unlock this Answer For Free Now!
View this answer and more for free by performing one of the following actions

Scan the QR code to install the App and get 2 free unlocks

Unlock quizzes for free by uploading documents