Refer to the graphs shown. The arrow that would best illustrate the impact on consumers of reducing sales tax on a good paid by suppliers is: 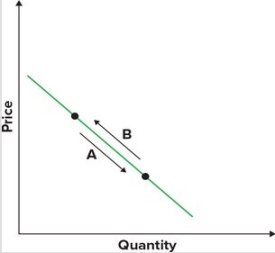
A) A.
B) B.
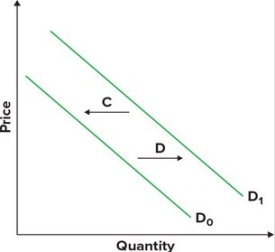
C) C.
D) D.
Correct Answer:
Verified
Q37: Given that diesel cars get much better
Q38: The effect of higher gasoline prices is
Q39: The growing popularity of a commercial weight-loss
Q40: The use of the phrase "other things
Q41: According to the law of supply:
A) supply
Q43: To derive a market demand curve from
Q44: Refer to the graph showing the demand
Q45: Consider the following demand table and the
Q46: Refer to the graphs shown. Assume the
Q47: Refer to the graphs shown. An increase
Unlock this Answer For Free Now!
View this answer and more for free by performing one of the following actions

Scan the QR code to install the App and get 2 free unlocks

Unlock quizzes for free by uploading documents