Refer to the graph shown that depicts a third-party payer market for prescription drugs. What happens to total expenditures in this market if a $2 co-pay is established compared to a free-market equilibrium? 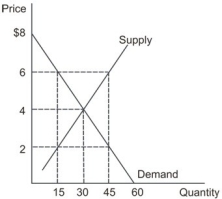
A) Expenditures rise to $240
B) Expenditures rise to $270
C) Expenditures fall by $120
D) Expenditures remain at $120
Correct Answer:
Verified
Q86: Refer to the graph shown that depicts
Q87: Refer to the graph shown. Given the
Q88: Refer to the graph shown. With a
Q89: Refer to the following graph. 
Q90: Refer to the graph shown. Given supply,
Q92: Refer to the graph shown that depicts
Q93: Refer to the graph shown that depicts
Q94: Refer to the following graph.
Q95: Refer to the following graph.
Q96: If government were to issue a fixed
Unlock this Answer For Free Now!
View this answer and more for free by performing one of the following actions

Scan the QR code to install the App and get 2 free unlocks

Unlock quizzes for free by uploading documents