Refer to the following graph. 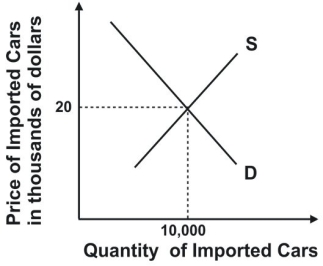 Suppose the graph depicted market demand for British cars sold in the United States. A tariff of $1,000 a car would result in tax revenue of:
A) $10 million.
B) less than $10 million.
C) greater than $10 million.
D) zero.
Correct Answer:
Verified
Q84: Taxi medallions were issued in New York
Q85: Refer to the graph shown. A quantity
Q86: Refer to the graph shown that depicts
Q87: Refer to the graph shown. Given the
Q88: Refer to the graph shown. With a
Q90: Refer to the graph shown. Given supply,
Q91: Refer to the graph shown that depicts
Q92: Refer to the graph shown that depicts
Q93: Refer to the graph shown that depicts
Q94: Refer to the following graph. 
Unlock this Answer For Free Now!
View this answer and more for free by performing one of the following actions

Scan the QR code to install the App and get 2 free unlocks

Unlock quizzes for free by uploading documents