The graph shown exhibits constant returns to scale: 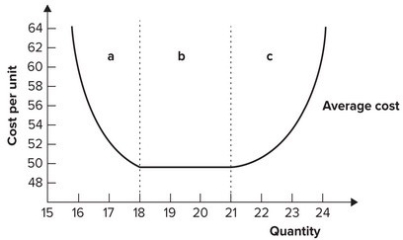
A) in region a.
B) in region b.
C) in region c.
D) in regions a, b, and c.
Correct Answer:
Verified
Q45: Refer to the graph shown. The output
Q46: Which of the following provides the best
Q47: Refer to the graph shown. The graph
Q48: Which of the following provides the best
Q49: Which of the following is most likely
Q51: Refer to the graph shown. The output
Q52: Using 100 workers and 10 machines, a
Q53: Diseconomies of scale are associated with:
A) an
Q54: The long-run average cost of producing 12
Q55: The graph shown exhibits diseconomies of scale:
Unlock this Answer For Free Now!
View this answer and more for free by performing one of the following actions

Scan the QR code to install the App and get 2 free unlocks

Unlock quizzes for free by uploading documents