Refer to the graph shown. The output range in region a is associated with: 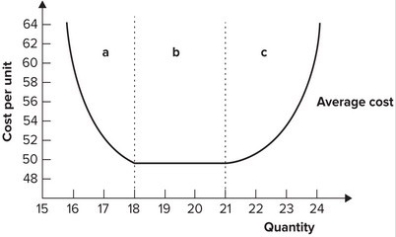
A) increasing marginal productivity.
B) constant returns to scale.
C) economies of scale.
D) diseconomies of scale.
Correct Answer:
Verified
Q46: Which of the following provides the best
Q47: Refer to the graph shown. The graph
Q48: Which of the following provides the best
Q49: Which of the following is most likely
Q50: The graph shown exhibits constant returns to
Q52: Using 100 workers and 10 machines, a
Q53: Diseconomies of scale are associated with:
A) an
Q54: The long-run average cost of producing 12
Q55: The graph shown exhibits diseconomies of scale:
Q56: The upward-sloping part of the long-run average
Unlock this Answer For Free Now!
View this answer and more for free by performing one of the following actions

Scan the QR code to install the App and get 2 free unlocks

Unlock quizzes for free by uploading documents