This OC curve represents a sampling plan developed for a lot size of 500,a sample size of 15,and an acceptance number of 2.The probability of acceptance for each of the first six points appears next to the plotted point.What is the average outgoing quality limit?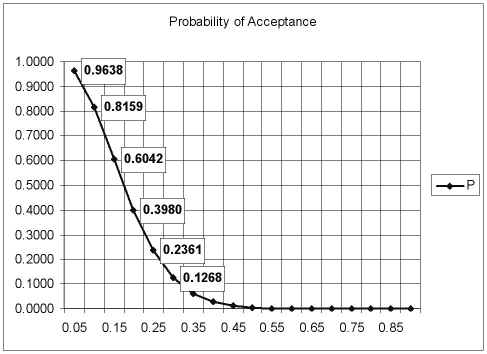
A) Less than 0.08.
B) Greater than or equal to 0.08 but less than 0.09.
C) Greater than or equal to 0.09 but less than 0.10.
D) Greater than or equal to 0.10.
Correct Answer:
Verified
Q5: _ is the worst level of quality
Q6: _ is the quality level desired by
Q26: A double-sampling plan has a lower _
Q44: A single-sampling plan using a sample
Q45: This OC curve represents a sampling plan
Q47: This OC curve represents a sampling plan
Q50: Champion Cooling Company has developed a
Q51: A single-sampling plan has the following
Q52: A single-sampling plan using a sample
Q53: This OC curve represents a sampling plan
Unlock this Answer For Free Now!
View this answer and more for free by performing one of the following actions

Scan the QR code to install the App and get 2 free unlocks

Unlock quizzes for free by uploading documents