This OC curve represents a sampling plan developed for a lot size of 1000,a sample size of 15,and an acceptance number of 2.The probability of acceptance for each of the first six points appears next to the plotted point.What incoming fraction defective is associated with the average outgoing quality limit?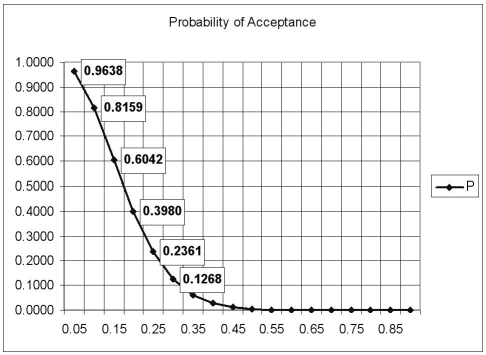
A) 0.10
B) 0.15
C) 0.20
D) 0.25
Correct Answer:
Verified
Q5: _ is the worst level of quality
Q6: _ is the quality level desired by
Q14: _ is the risk that the sampling
Q17: _ is the risk that a lot
Q49: This OC curve represents a sampling plan
Q50: Champion Cooling Company has developed a
Q51: A single-sampling plan has the following
Q52: A single-sampling plan using a sample
Q55: A lot of 2,000 items has just
Q58: The average outgoing quality (AOQ)is
A) the proportion
Unlock this Answer For Free Now!
View this answer and more for free by performing one of the following actions

Scan the QR code to install the App and get 2 free unlocks

Unlock quizzes for free by uploading documents