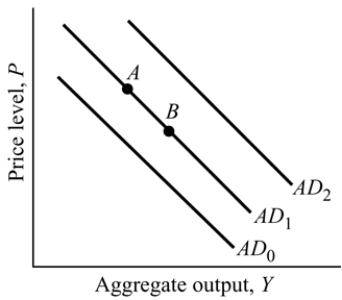
 Figure 9.1
-Refer to Figure 9.1. When the price level rises and causes lower consumption expenditures, it is illustrated as:
A) a move from Point A to Point B, but not a shift of the aggregate demand curve.
B) an aggregate demand curve shift from AD1 to AD2.
C) a move from Point B to Point A, but not a shift of the aggregate demand curve.
D) an aggregate demand curve shift from AD1 to AD0.
Correct Answer:
Verified
Q120: Recall Application 3, "How the U.S. Economy
Q121: Prices that do not always adjust rapidly
Q122: If the economy is in equilibrium at
Q123: In the short run, an increase in
Q124: Recall Application 2, "Two Approaches to Determining
Unlock this Answer For Free Now!
View this answer and more for free by performing one of the following actions

Scan the QR code to install the App and get 2 free unlocks

Unlock quizzes for free by uploading documents