 Figure 9.1
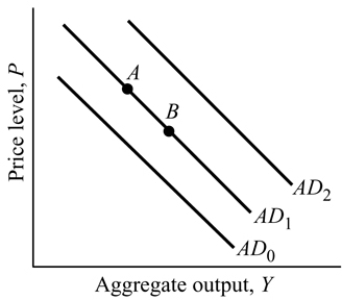
-Refer to Figure 9.1. When the price level drops and causes a higher net exports, it is illustrated as:
A) an aggregate demand curve shift from AD1 to AD0.
B) an aggregate demand curve shift from AD1 to AD2.
C) a move from Point A to Point B, but not a shift of the aggregate demand curve.
D) a move from Point B to Point A, but not shift of the aggregate demand curve.
Correct Answer:
Verified
Q121: Prices that do not always adjust rapidly
Q122: If the economy is in equilibrium at
Q123: In the short run, an increase in
Q124: Recall Application 2, "Two Approaches to Determining
Q125: Q127: In the short- run, an increase in Q128: The four components of the aggregate demand Q129: A rightward shift in the aggregate demand Q130: Explain the wealth effect on aggregate demand. Q131: ![]()
![]()
Unlock this Answer For Free Now!
View this answer and more for free by performing one of the following actions

Scan the QR code to install the App and get 2 free unlocks

Unlock quizzes for free by uploading documents