Use the figure below to answer the following questions.
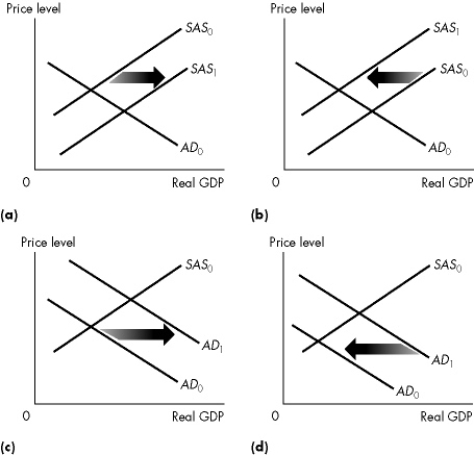 Figure 10.2.1
-Refer to Figure 10.2.1.Which graph illustrates the effect of an increase in expected future income?
A) a only
B) b only
C) c only
D) d only
E) Both a and c
Correct Answer:
Verified
Q45: Use the figure below to answer the
Q46: When the actual unemployment rate is equal
Q47: Use the figure below to answer the
Q48: Use the figure below to answer the
Q49: A recessionary gap is the amount by
Q51: Which one of the following newspaper quotations
Q52: The Canadian price level rises.What is the
Q53: Which one of the following newspaper quotations
Q54: Full- employment equilibrium occurs when
A)all who are
Q55: Use the figure below to answer the
Unlock this Answer For Free Now!
View this answer and more for free by performing one of the following actions

Scan the QR code to install the App and get 2 free unlocks

Unlock quizzes for free by uploading documents