Use the figure below to answer the following questions.
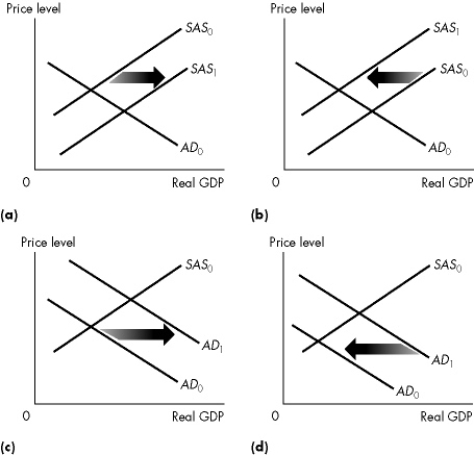 Figure 10.2.1
-Refer to Figure 10.2.1.Which graph illustrates the effect of a decrease in the quantity of money?
A) a only
B) b only
C) c only
D) d only
E) Both b and d
Correct Answer:
Verified
Q40: Which one of the following variables can
Q41: An inflationary gap is the amount by
Q42: Which of the following does not change
Q43: Everything else remaining the same, an increase
Q44: Canadian firms build new pipelines across the
Q46: When the actual unemployment rate is equal
Q47: Use the figure below to answer the
Q48: Use the figure below to answer the
Q49: A recessionary gap is the amount by
Q50: Use the figure below to answer the
Unlock this Answer For Free Now!
View this answer and more for free by performing one of the following actions

Scan the QR code to install the App and get 2 free unlocks

Unlock quizzes for free by uploading documents