Use the figure below to answer the following questions.
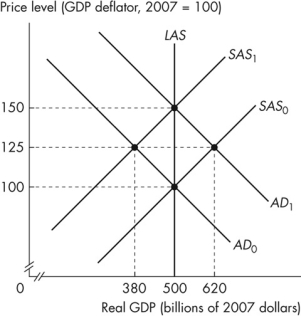 Figure 12.2.3
-Refer to Figure 12.2.3.Assume that the figure illustrates an economy initially in equilibrium at the intersection of the SAS0 curve and the AD0 curve.If the aggregate demand curve is correctly expected to shift to AD1, new equilibrium real GDP is _______ and the new equilibrium price level is _______.
A) $500 billion; 150
B) $620 billion; 125
C) $380 billion; 125
D) $500 billion; 100
E) $500 billion; 125
Correct Answer:
Verified
Q54: Use the figure below to answer the
Q55: Use the figure below to answer the
Q56: A forecast based on all the relevant
Q57: Use the figure below to answer the
Q58: Use the figure below to answer the
Q60: An increase in the price level due
Q61: A correctly anticipated increase in the quantity
Q62: The short- run Phillips curve shows the
Q63: A forecast that is based on all
Q64: Deflation ends with
A)a rise in the interest
Unlock this Answer For Free Now!
View this answer and more for free by performing one of the following actions

Scan the QR code to install the App and get 2 free unlocks

Unlock quizzes for free by uploading documents