Use the figure below to answer the following questions.
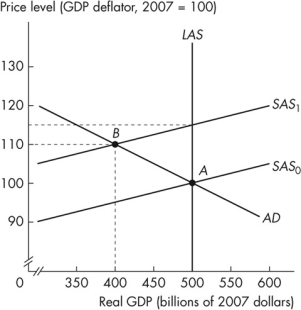 Figure 12.2.2
-Refer to Figure 12.2.2.The vertical distance between SAS0 and SAS1 represents the
A) actual decrease in real GDP.
B) expected decrease in the real wage rate.
C) actual inflation rate.
D) expected increase in real GDP.
E) expected inflation rate.
Correct Answer:
Verified
Q49: Use the figure below to answer the
Q50: Cost- push inflation can result from an
Q51: Use the figure below to answer the
Q52: Suppose the quantity of money is expected
Q53: Use the figure below to answer the
Q55: Use the figure below to answer the
Q56: A forecast based on all the relevant
Q57: Use the figure below to answer the
Q58: Use the figure below to answer the
Q59: Use the figure below to answer the
Unlock this Answer For Free Now!
View this answer and more for free by performing one of the following actions

Scan the QR code to install the App and get 2 free unlocks

Unlock quizzes for free by uploading documents