The diagram below shows two production possibilities boundaries for Country X.
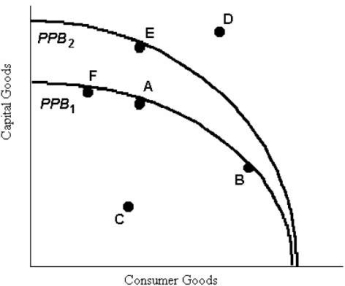 FIGURE 1- 4
-Refer to Figure 1- 4.The production possibilities boundaries are drawn concave to the origin.What does this shape of the PPB demonstrate?
A) the increasing opportunity cost of producing more of either good
B) the decreasing opportunity cost of producing more of either good
C) the unfair distribution of resources in the economy
D) the scarcity of resources in the economy
E) the constant opportunity cost of producing more of either good
Correct Answer:
Verified
Q78: The downward- sloping line in the diagram
Q79: With reference to the circular flow of
Q80: A country's production possibilities boundary shows that
A)when
Q81: The diagram below shows two production possibilities
Q82: In general,which of the following statements is
Q84: A farmer selling tomatoes and corn at
Q86: The table below illustrates that,in one
Q87: The diagram below shows two production possibilities
Q88: Economics can best be described as
A)the study
Q134: In a pure market economy,the role of
Unlock this Answer For Free Now!
View this answer and more for free by performing one of the following actions

Scan the QR code to install the App and get 2 free unlocks

Unlock quizzes for free by uploading documents