The diagram below shows two production possibilities boundaries for Country X.
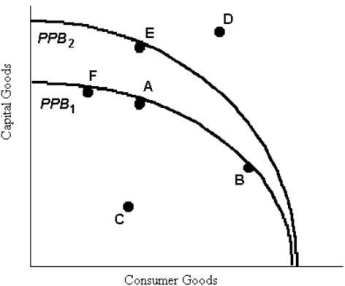 FIGURE 1- 4
-Refer to Figure 1- 4.A shift of the production possibilities boundary from PPB1 to PPB2 implies
A) that technology in the consumer goods industry has improved.
B) that technology in the capital goods industries has improved.
C) an inevitable decrease in total output.
D) a movement from full employment to some unemployment.
E) that if point E is the new choice of outputs,productivity has increased in the consumer goods industry.
Correct Answer:
Verified
Q76: The table below shows that,in one
Q77: Suppose that one unit of labour can
Q78: The downward- sloping line in the diagram
Q79: With reference to the circular flow of
Q80: A country's production possibilities boundary shows that
A)when
Q82: In general,which of the following statements is
Q83: The diagram below shows two production possibilities
Q84: A farmer selling tomatoes and corn at
Q86: The table below illustrates that,in one
Q134: In a pure market economy,the role of
Unlock this Answer For Free Now!
View this answer and more for free by performing one of the following actions

Scan the QR code to install the App and get 2 free unlocks

Unlock quizzes for free by uploading documents