FIGURE 13- 4 The three diagrams below each show a supply curve for oil tankers over a relatively short period of time.
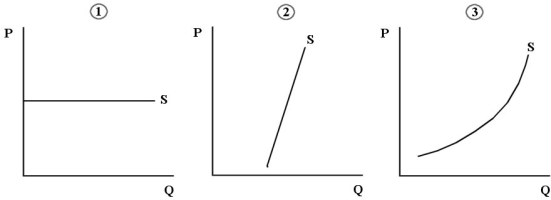
-Refer to Figure 13- 4.Consider oil tankers as a factor of production (for example,for the production of gasoline) .Which diagram shows the most mobility of this factor of production?
A) diagram 1
B) diagram 2
C) diagram 3
D) none of the diagrams
E) each diagram shows mobility
Correct Answer:
Verified
Q102: The "functional distribution of income" refers to
Q103: The diagram below shows the MRP curve
Q104: Consider the following production and cost
Q105: Steve Nash is a highly paid professional
Q106: The table below shows the total
Q108: A condition for the profit- maximizing use
Q109: The diagram below shows the MRP curve
Q110: The table below shows the total
Q111: The table below shows the total
Q112: The theory of equal net advantage is
Unlock this Answer For Free Now!
View this answer and more for free by performing one of the following actions

Scan the QR code to install the App and get 2 free unlocks

Unlock quizzes for free by uploading documents