The diagram below shows the MRP curve for a firm producing copper plumbing pipe.The factor of production being considered here is hours of labour.
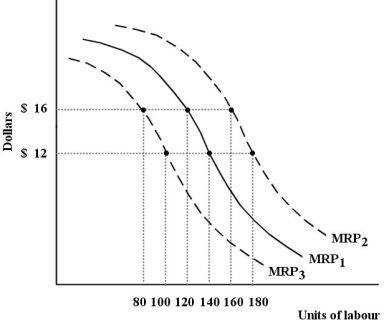 FIGURE 13- 2
-The diagonal line on a Lorenz curve diagram represents
A) the percentage of income received by the top 50% of families.
B) the degree of inequality in the distribution of income.
C) the dollar incomes of the bottom 50% of families.
D) the percentage of income received by the bottom 50% of families.
E) where the Lorenz curve would be if there were complete income equality.
Correct Answer:
Verified
Q104: Consider the following production and cost
Q105: Steve Nash is a highly paid professional
Q106: The table below shows the total
Q107: FIGURE 13- 4 The three diagrams below
Q108: A condition for the profit- maximizing use
Q110: The table below shows the total
Q111: The table below shows the total
Q112: The theory of equal net advantage is
Q113: FIGURE 13- 1 Q114: Which of the following statements concerning factor![]()
Unlock this Answer For Free Now!
View this answer and more for free by performing one of the following actions

Scan the QR code to install the App and get 2 free unlocks

Unlock quizzes for free by uploading documents