The table below shows the approximate value of Canada's crude oil and natural gas exports over a 5-year period.The amounts shown are billions of dollars. 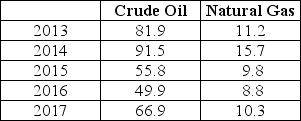 TABLE 2-7 Refer to Table 2-7.Assume that 2013 is the base year,with an index number = 100.What is the percentage change in the value of exports of crude oil from 2013 to 2017?
A) -18.3%
B) -183.2%
C) -100%
D) 18.3%
E) 183.2%
Correct Answer:
Verified
Q74: The table below shows hypothetical data for
Q75: The table below shows hypothetical prices for
Q76: The table below shows hypothetical data for
Q77: The table below shows hypothetical data for
Q78: The table below shows hypothetical data for
Q80: The table below shows hypothetical data for
Q81: The table below shows the approximate value
Q82: Consider the following equation: Y = 10
Q83: The mathematical expression of a relationship between
Q84: The table below shows the approximate value
Unlock this Answer For Free Now!
View this answer and more for free by performing one of the following actions

Scan the QR code to install the App and get 2 free unlocks

Unlock quizzes for free by uploading documents