The table below shows hypothetical data for volumes of e-books and hardcover books sold over a 3-year period in a particular city. 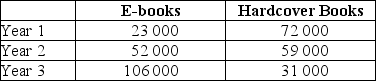 TABLE 2-3 Refer to Table 2-3.Between Year 1 and Year 3,what is the percentage change in sales of hardcover books?
A) 0.569%
B) 56.9%
C) -56.9%
D) -0.569%
E) -569%
Correct Answer:
Verified
Q69: The table below shows hypothetical prices for
Q70: The table below shows hypothetical prices for
Q71: The table below shows the approximate value
Q72: The table below shows hypothetical data for
Q73: The table below shows the approximate value
Q75: The table below shows hypothetical prices for
Q76: The table below shows hypothetical data for
Q77: The table below shows hypothetical data for
Q78: The table below shows hypothetical data for
Q79: The table below shows the approximate value
Unlock this Answer For Free Now!
View this answer and more for free by performing one of the following actions

Scan the QR code to install the App and get 2 free unlocks

Unlock quizzes for free by uploading documents