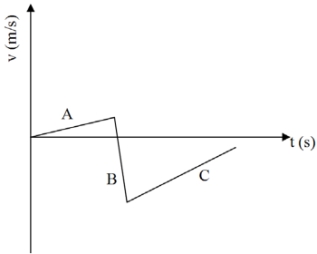
An object's distance traveled as a function of time is shown in the graph above. The graph shows
A) an object experiencing an acceleration.
B) an object with increasing speed.
C) an object turning in a circle.
D) an object moving forward.
Correct Answer:
Verified
Q33: A car is decelerating at the rate
Q34: A body travels at an initial speed
Q35: Refer to diagram of billiard balls F,
Q36: Refer to the graph above. For the
Q37: Refer to the speedometer in Figure 2.3.
Q39: A car moving initially at 30 m/s
Q40: Which of the following is not an
Q41: This special racetrack is all curve and
Q42: From a graph of speed versus time,
Q43: A speed of 150 km/hr is equivalent
Unlock this Answer For Free Now!
View this answer and more for free by performing one of the following actions

Scan the QR code to install the App and get 2 free unlocks

Unlock quizzes for free by uploading documents