TABLE 18-2
A political pollster randomly selects a sample of 100 voters each day for 8 successive days and asks how many will vote for the incumbent.The pollster wishes to construct a p chart to see if the percentage favoring the incumbent candidate is too erratic. 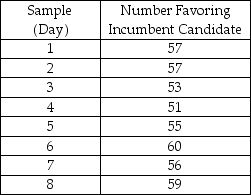
-Referring to Table 18-2,what is the numerical value of the center line for the p chart?
A) 0.53
B) 0.56
C) 0.63
D) 0.66
Correct Answer:
Verified
Q2: Which of the following situations suggests a
Q6: The control chart
A)focuses on the time dimension
Q12: Which of the following situations suggests a
Q13: Variation due to the inherent variability in
Q14: TABLE 18-2
A political pollster randomly selects a
Q17: A process is said to be out
Q18: TABLE 18-2
A political pollster randomly selects a
Q20: TABLE 18-1
A local newspaper has 10 delivery
Q21: TABLE 18-4
A factory supervisor is concerned that
Q22: TABLE 18-3
A quality control analyst for a
Unlock this Answer For Free Now!
View this answer and more for free by performing one of the following actions

Scan the QR code to install the App and get 2 free unlocks

Unlock quizzes for free by uploading documents