TABLE 18-1
A local newspaper has 10 delivery boys who each deliver the morning paper to 50 customers every day.The owner decides to record the number of papers delivered on time for a 10-day period for one of the delivery boys and construct a p chart to see whether the percentage is too erratic. 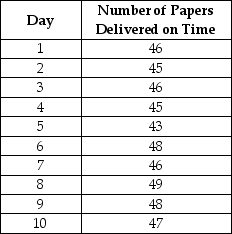
-Referring to Table 18-1,what is the numerical value of the center line for the p chart?
A) 0.926
B) 0.911
C) 0.885
D) 0.500
Correct Answer:
Verified
Q6: The control chart
A)focuses on the time dimension
Q12: Which of the following situations suggests a
Q17: TABLE 18-2
A political pollster randomly selects a
Q17: A process is said to be out
Q18: TABLE 18-2
A political pollster randomly selects a
Q21: TABLE 18-4
A factory supervisor is concerned that
Q22: TABLE 18-3
A quality control analyst for a
Q23: TABLE 18-4
A factory supervisor is concerned that
Q24: TABLE 18-3
A quality control analyst for a
Q25: TABLE 18-4
A factory supervisor is concerned that
Unlock this Answer For Free Now!
View this answer and more for free by performing one of the following actions

Scan the QR code to install the App and get 2 free unlocks

Unlock quizzes for free by uploading documents