Use the figure below to answer the following questions.
Table 3.5.2
Demand and Supply Schedules for Cups of Coffee each day at CoolU
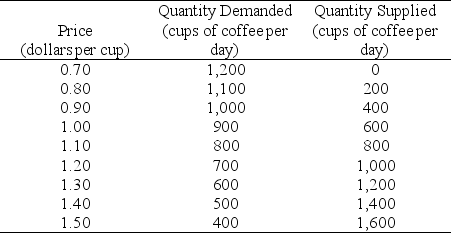
-Refer to Table 3.5.2.Professor Hyper publishes a new study,showing that coffee raises the test performance of students.Students double their demand for coffee.This change would be represented as a
A) leftward shift of the demand curve.
B) rightward shift of the demand curve.
C) leftward shift of the supply curve.
D) rightward shift of the supply curve.
E) movement up along the demand curve.
Correct Answer:
Verified
Q146: Use the figure below to answer the
Q147: Use the figure below to answer the
Q148: Use the figure below to answer the
Q149: Use the figure below to answer the
Q150: Use the figure below to answer the
Q152: Use the table below to answer the
Q153: Use the table below to answer the
Q154: Use the figure below to answer the
Q155: "As domestic car prices have increased,consumers have
Q156: Use the figure below to answer the
Unlock this Answer For Free Now!
View this answer and more for free by performing one of the following actions

Scan the QR code to install the App and get 2 free unlocks

Unlock quizzes for free by uploading documents