Use the figure below to answer the following questions.
Table 3.5.2
Demand and Supply Schedules for Cups of Coffee each day at CoolU
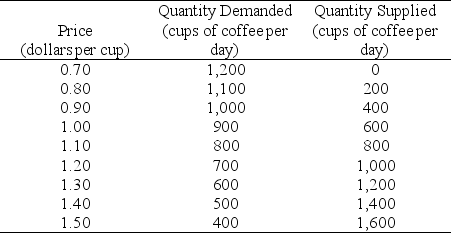
-Refer to Table 3.5.2.A premature frost destroys half the coffee trees.This change would be represented as a
A) leftward shift of the demand curve.
B) rightward shift of the demand curve.
C) leftward shift of the supply curve.
D) rightward shift of the supply curve.
E) movement down along the supply curve.
Correct Answer:
Verified
Q142: Use the figure below to answer the
Q143: Use the figure below to answer the
Q144: Use the figure below to answer the
Q145: Use the figure below to answer the
Q146: Use the figure below to answer the
Q148: Use the figure below to answer the
Q149: Use the figure below to answer the
Q150: Use the figure below to answer the
Q151: Use the figure below to answer the
Q152: Use the table below to answer the
Unlock this Answer For Free Now!
View this answer and more for free by performing one of the following actions

Scan the QR code to install the App and get 2 free unlocks

Unlock quizzes for free by uploading documents