The accompanying figure shows the decision tree of an operations manager who is considering a new production technique. ER represents his expected return (in thousand $) from the new technique. If he does not adopt the technique his expected return would be zero. The probabilities of the technique being a success or a failure are .7 and .3 respectively. Compute the expected return (in thousand $) from the adoption of the new production technique. 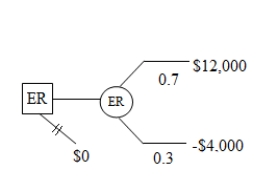
A) $8,400
B) $1,000
C) -$2,000
D) $7,200
E) $8,000
Correct Answer:
Verified
Q7: The expected profit determined from a decision
Q8: Which of the following is true of
Q9: A convenient way to represent decisions, chance
Q10: An individual is uncertain whether to bet
Q11: The probability of an outcome:
A) ranges between
Q13: A risky outcome's expected value is:
A) the
Q14: Decision trees are numerically evaluated:
A) From left
Q15: Risk aversion describes a person's tendency to:
A)
Q16: Which of the following is true of
Q17: When there is multiple possible outcomes from
Unlock this Answer For Free Now!
View this answer and more for free by performing one of the following actions

Scan the QR code to install the App and get 2 free unlocks

Unlock quizzes for free by uploading documents