The demand for an item over the last year is plotted below.Develop a forecast and explain why your approach is reasonable. 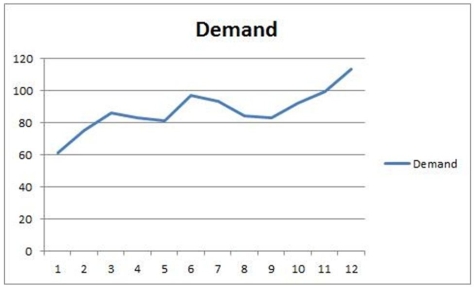
Correct Answer:
Verified
View Answer
Unlock this answer now
Get Access to more Verified Answers free of charge
Q124: Calculate three forecasts using the following data.First,for
Q125: Three weeks of data are available from
Q126: A local moving company has collected data
Q127: Combination forecasting is a method of forecasting
Q129: Table 8.8
The manager of a pizza shop
Q131: The Bahouth Company wants to develop a
Q133: Barney took what he liked to call
Q134: _ is a time-series method used to
Q137: Better forecasting processes yield better forecasts.
Q140: A(n) _ is a portion of data
Unlock this Answer For Free Now!
View this answer and more for free by performing one of the following actions

Scan the QR code to install the App and get 2 free unlocks

Unlock quizzes for free by uploading documents