According to the following graphs,what does the curve in the lower graph show? 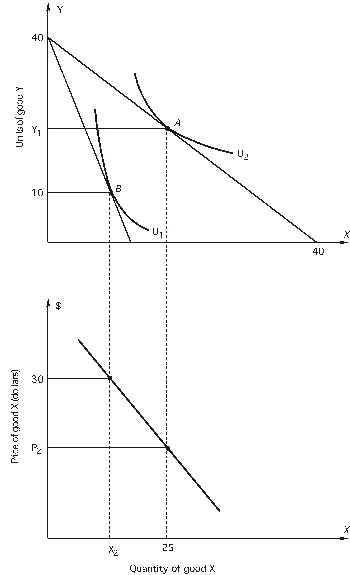 The price of Y is $15 per unit.
A) how a consumer's utility-maximizing choices of X and Y change when the budget constraint changes
B) how a consumer's preferences change when income changes
C) how a consumer's utility-maximizing choices of X changes when the price of X changes
D) how a consumer's utility-maximizing choices of Y changes when the price of Y changes
E) both c and d
Correct Answer:
Verified
Q41: Suppose that 25 units of X and
Q42: According to the following graphs,what is
Q43: What is the equation for budget line
Q44: The price of X is $20 and
Unlock this Answer For Free Now!
View this answer and more for free by performing one of the following actions

Scan the QR code to install the App and get 2 free unlocks

Unlock quizzes for free by uploading documents