Multiple Choice
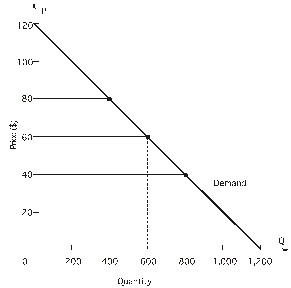 In the figure above,what is demand elasticity over the price range $40 to $60?
A) -2.00
B) -1.00
C) -0.50
D) -0.95
E) -0.71
Correct Answer:
Verified
Related Questions
Q2: Q3: Q4: Q5: the figure below,which shows a linear demand Q6: Q8: the figure below,which shows a linear demand Q9: the figure below,which shows a linear demand Q10: Use the figure below,which shows a linear Q11: Q12: Unlock this Answer For Free Now! View this answer and more for free by performing one of the following actions Scan the QR code to install the App and get 2 free unlocks Unlock quizzes for free by uploading documents![]()
![]()
![]()
![]()
![]()
![]()

