Table 5.3
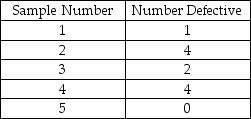
-Four samples of 100 each were taken from an assembly line,with the following results: 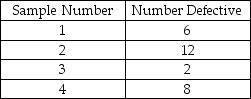 Using the historical average as the central line of the chart,which one of the following is the limit for an attributes control chart with z = 2?
A) UCL > 0.1 and LCL > 0.03
B) UCL > 0.1 and LCL < 0.03
C) UCL < 0.1 and LCL > 0.03
D) UCL < 0.1 and LCL < 0.03
Correct Answer:
Verified
Q107: Historically, the average proportion of defective bars
Q113: Historically, the average proportion of defective bars
Q132: Use the data in Table 5.4. What
Q133: Historically,the average proportion of defective bars has
Q138: Table 5.4
The manager of Champion Cooling Company
Q139: Table 5.4
The manager of Champion Cooling Company
Q150: Process capability can be addressed when:
A) assignable
Q157: A metal-cutting operation has a target value
Q173: Which of these ISO standards has the
Q177: A manufacturer embarking on a Six Sigma
Unlock this Answer For Free Now!
View this answer and more for free by performing one of the following actions

Scan the QR code to install the App and get 2 free unlocks

Unlock quizzes for free by uploading documents