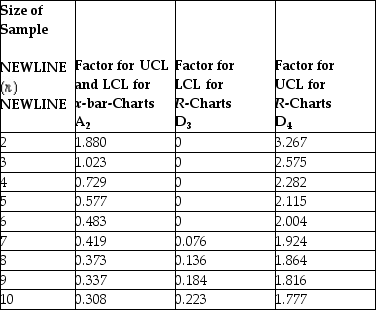
Table 5.1
Factors for Calculating Three-Sigma Limits for the  Chart and R-Chart
 Source: 1950 ASTM Manual on Quality Control of Materials,copyright American Society for Testing Materials.Reprinted with permission.
-A milling operation has historically produced an average thickness of 0.005 inch with an average range of 0.0015 inch.Currently,the first three items from each batch of 20 are inspected.Use Table 5.1.What is the value of the lower control limit for the x-bar chart?
A) less than or equal to 0.00100
B) greater than 0.00100 but less than or equal to 0.00299
C) greater than 0.00299 but less than or equal to 0.00499
D) greater than 0.00499
Correct Answer:
Verified
Q88: The underlying statistical distribution for the p-chart
Q105: Historically,the average diameter of the holes drilled
Q105: The consultant suspiciously eyed the c-chart that
Q107: Historically,the average time to service a customer
Q108: Five samples of size 4 were taken
Unlock this Answer For Free Now!
View this answer and more for free by performing one of the following actions

Scan the QR code to install the App and get 2 free unlocks

Unlock quizzes for free by uploading documents