Table 7.2 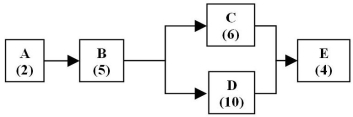 The figure above shows the process for paying tuition at a major university.Students are provided their bill for the next term for review,then routed to different tables for questions to be answered before finally paying their tuition at E.The numbers in parentheses are the time in minutes for each step of the process.
-Use the information in Table 7.2.If 60% of the students are routed to C and 40% are routed to D,what is the average capacity per hour for the process?
A) 10 students per hour
B) 6.5 student per hour
C) 8 students per hour
D) 8.4 students per hour
Correct Answer:
Verified
Q5: The fifth step in Theory of Constraints
Q17: The fourth step in Theory of Constraints
Q39: According to the Theory of Constraints,the four
Q40: Use the process flow diagram to determine
Q41: Table 7.4 Q43: Table 7.2 Q44: Table 7.2 Q45: Table 7.5 Q46: Table 7.3 Q47: Table 7.2 Unlock this Answer For Free Now! View this answer and more for free by performing one of the following actions Scan the QR code to install the App and get 2 free unlocks Unlock quizzes for free by uploading documents![]()
![]()
![]()
A company makes four products that![]()
![]()

