A quality analyst wants to construct a sample mean chart for controlling a packaging process.He knows from past experience that the process standard deviation is two ounces.Each day last week,he randomly selected four packages and weighed each.The data from that activity appear below.
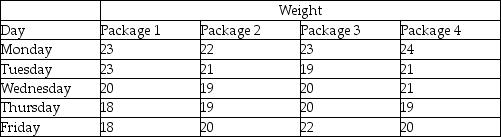 (a)Calculate all sample means and the mean of all sample means.
(b)Calculate upper and lower 2-sigma x-bar chart control limits that allow for natural variations.
(c)Based on the x-bar chart,is this process in control?
Correct Answer:
Verified
View Answer
Unlock this answer now
Get Access to more Verified Answers free of charge
Q62: A hospital-billing auditor has been inspecting patient
Q67: Repeated sampling of a certain process shows
Q70: A quality analyst wants to construct a
Q71: Ten samples of size four were taken
Q76: McDaniel Shipyards wants to develop a control
Q78: An operator trainee is attempting to monitor
Q78: A small,independent amusement park collects data on
Q183: Why do range charts exist? Aren't x-bar
Q192: What is the difference between natural and
Q200: A local manufacturer supplies you with parts,
Unlock this Answer For Free Now!
View this answer and more for free by performing one of the following actions

Scan the QR code to install the App and get 2 free unlocks

Unlock quizzes for free by uploading documents